
No marketing story, just the real output of the report—so you know exactly what to expect.

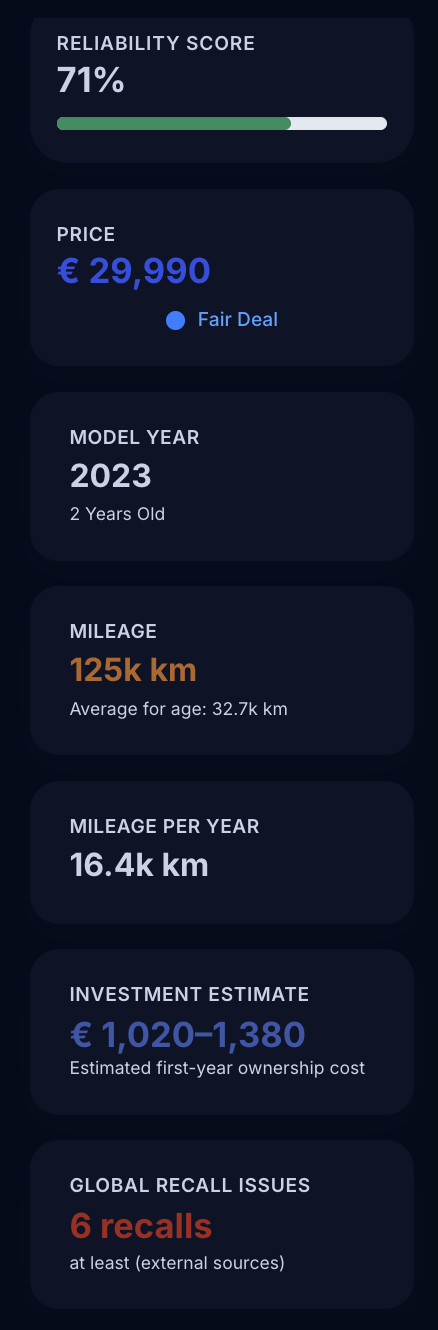
Report Indicators
Reliability score (%)
A percentile derived from aggregated model data and historical repairs.
Price & deal assessment
Price relative to the fair range and market comparables.
Model year & age
Model year versus actual age highlights depreciation or staleness.
Mileage vs expected average
Mileage compared to expectations for similar mileage/age combinations.
Mileage per year
Annual mileage normalized to age and usage patterns.
Investment estimate (first-year)
Projected first-year repair spend if the highlighted risks surface.
Recall count
Known recalls aggregated from manufacturer and regulatory sources.
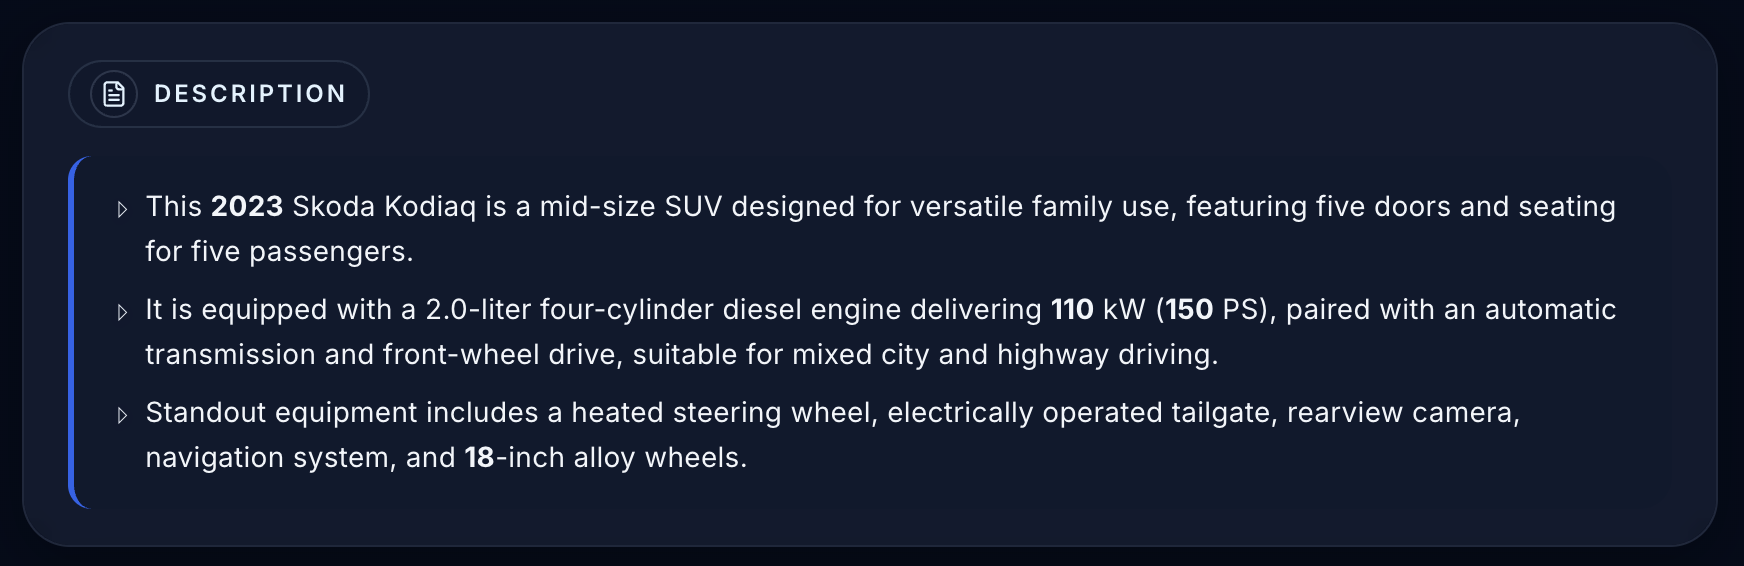
Vehicle description
Every sentence is parsed from the listing text and normalized — we only structure what is present.
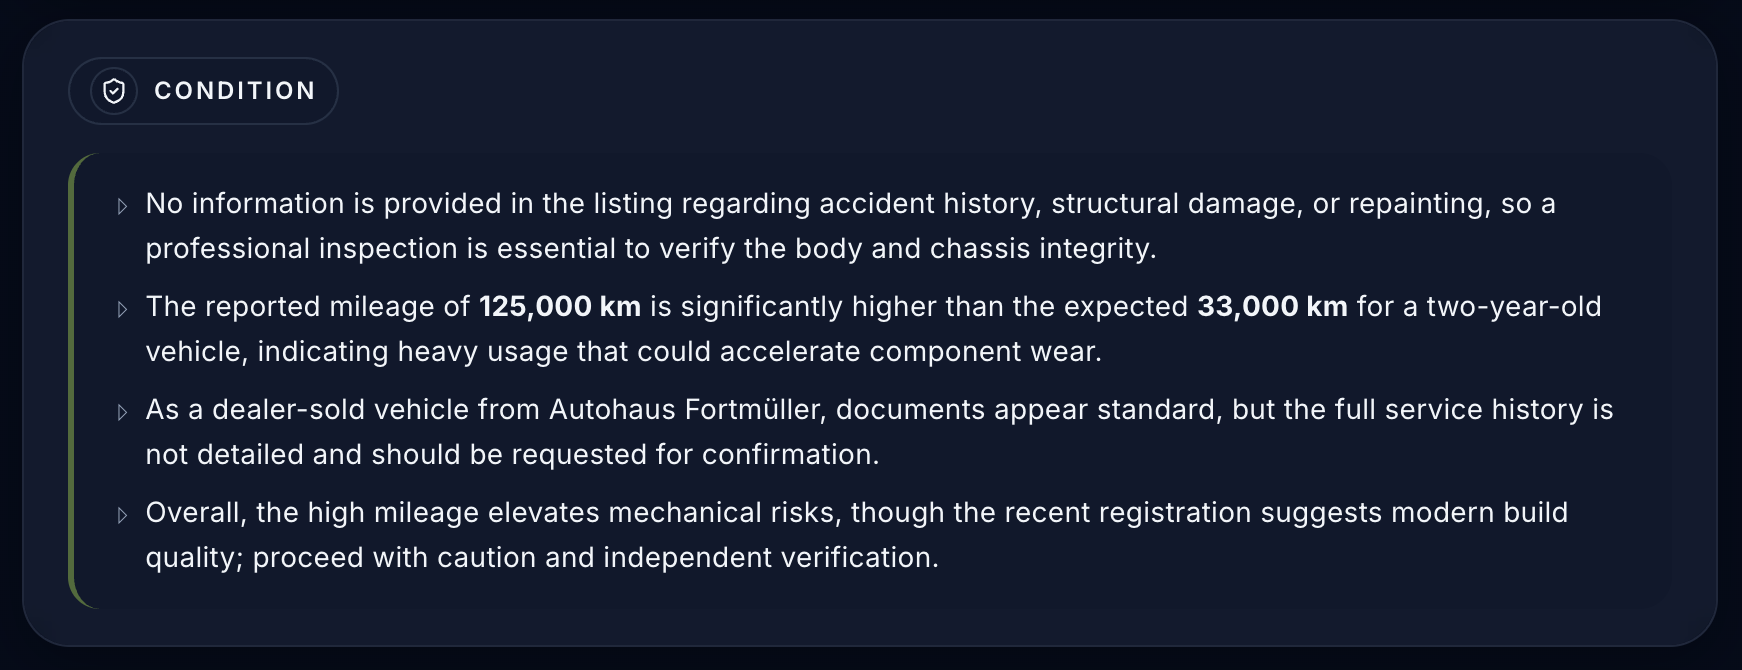
Condition analysis
Signals point to what matters now: absent accident history, mileage/age gaps, dealer tone, and inspection triggers.
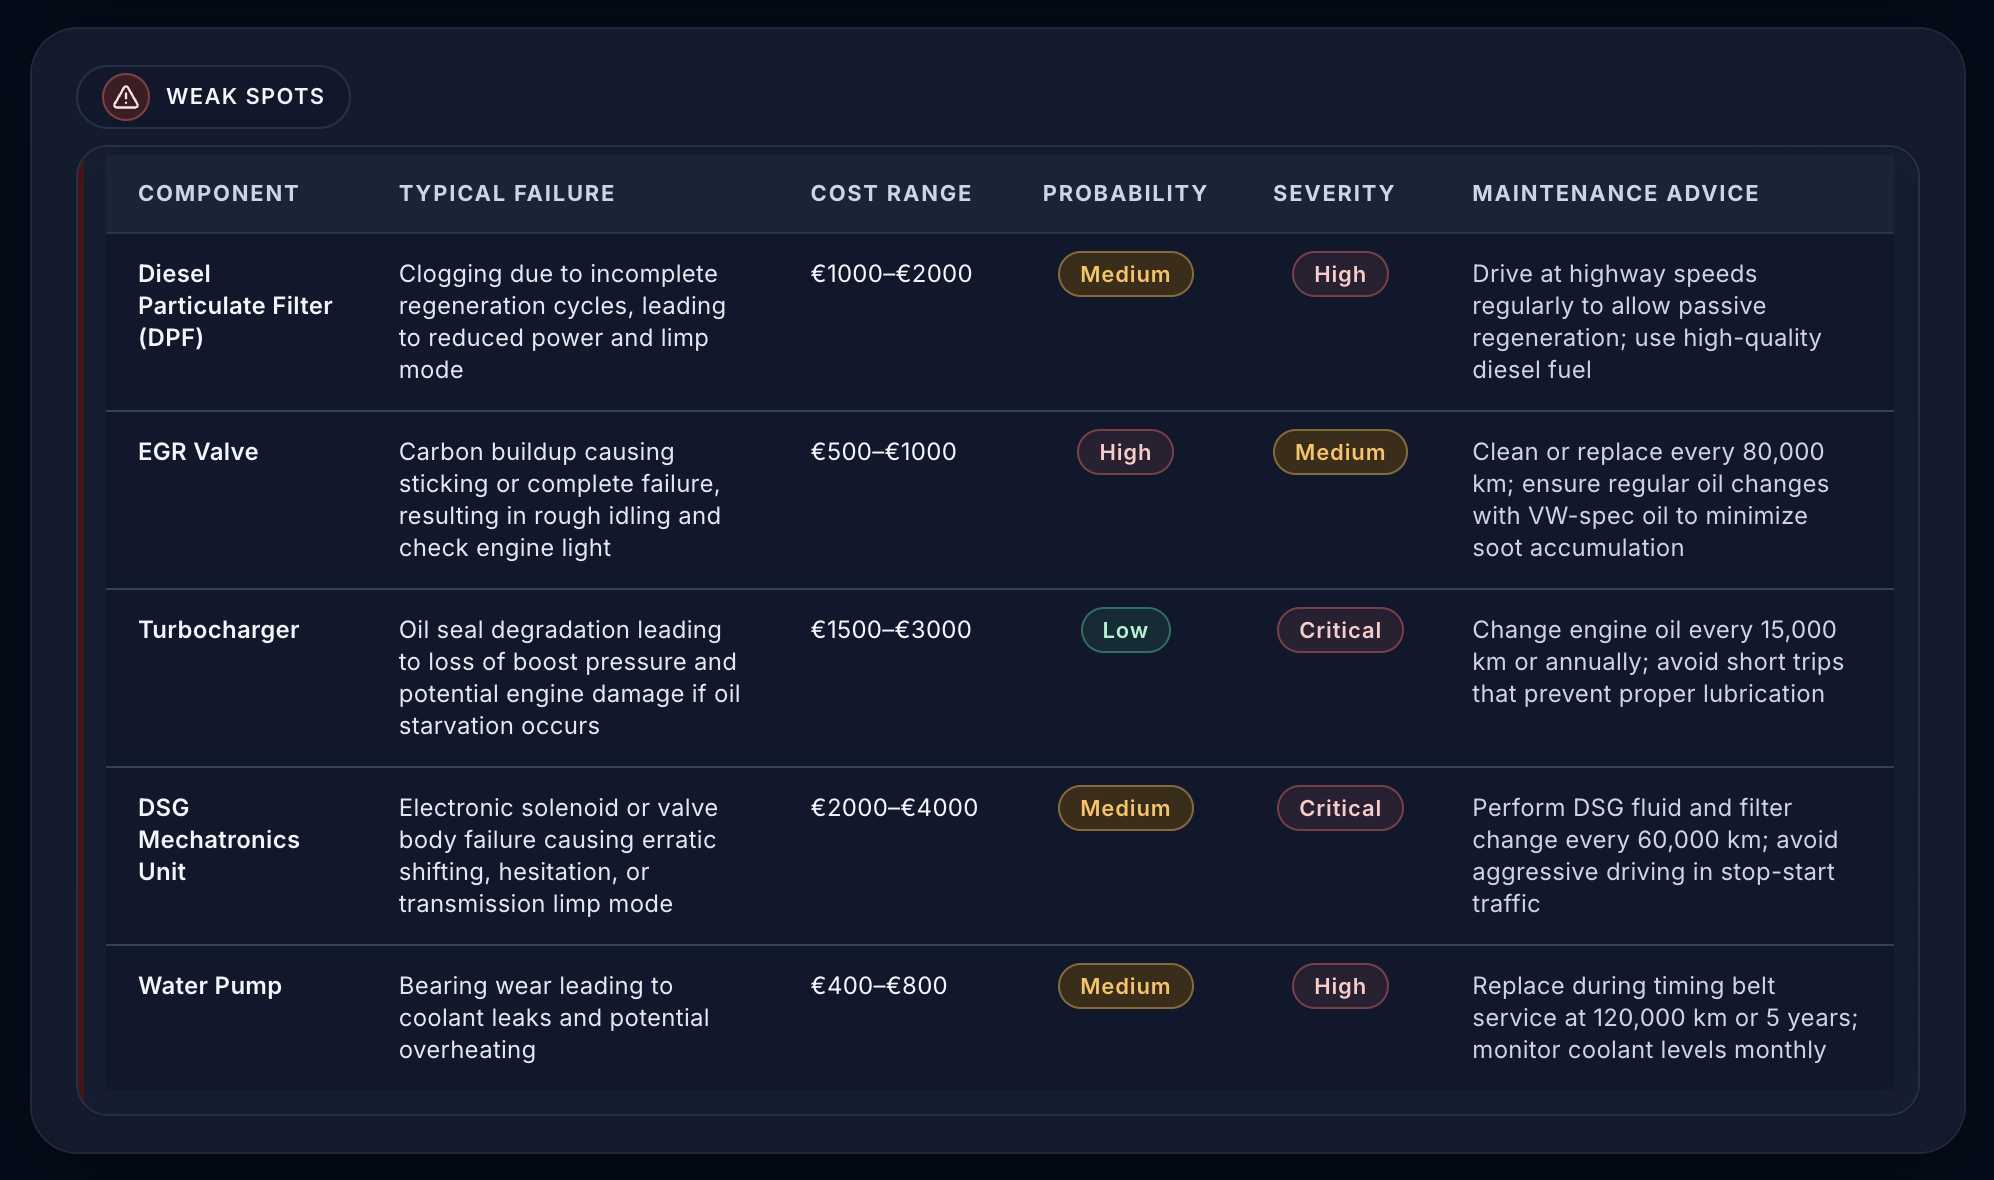
Known weak spots for this model
The table surfaces statistically frequent failures without implying this specific car failed.
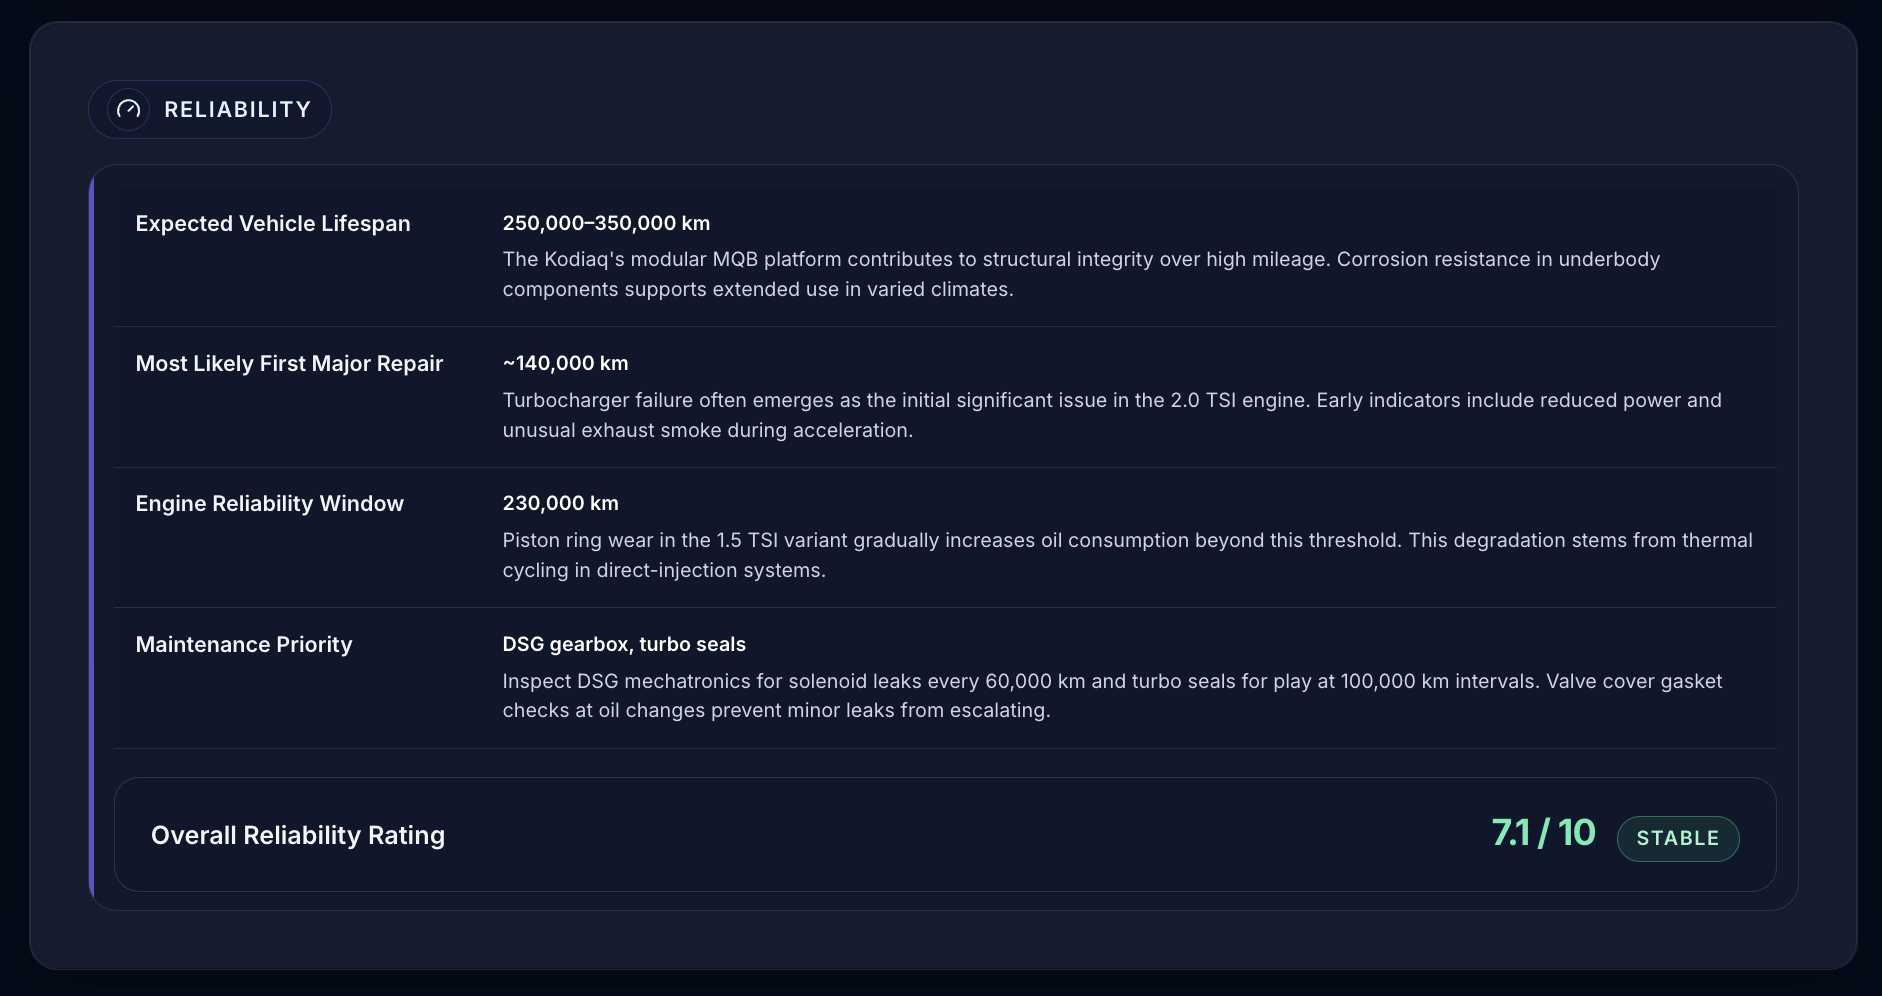
Reliability outlook
Explore how the percentile is composed and what it says about the model and powertrain.
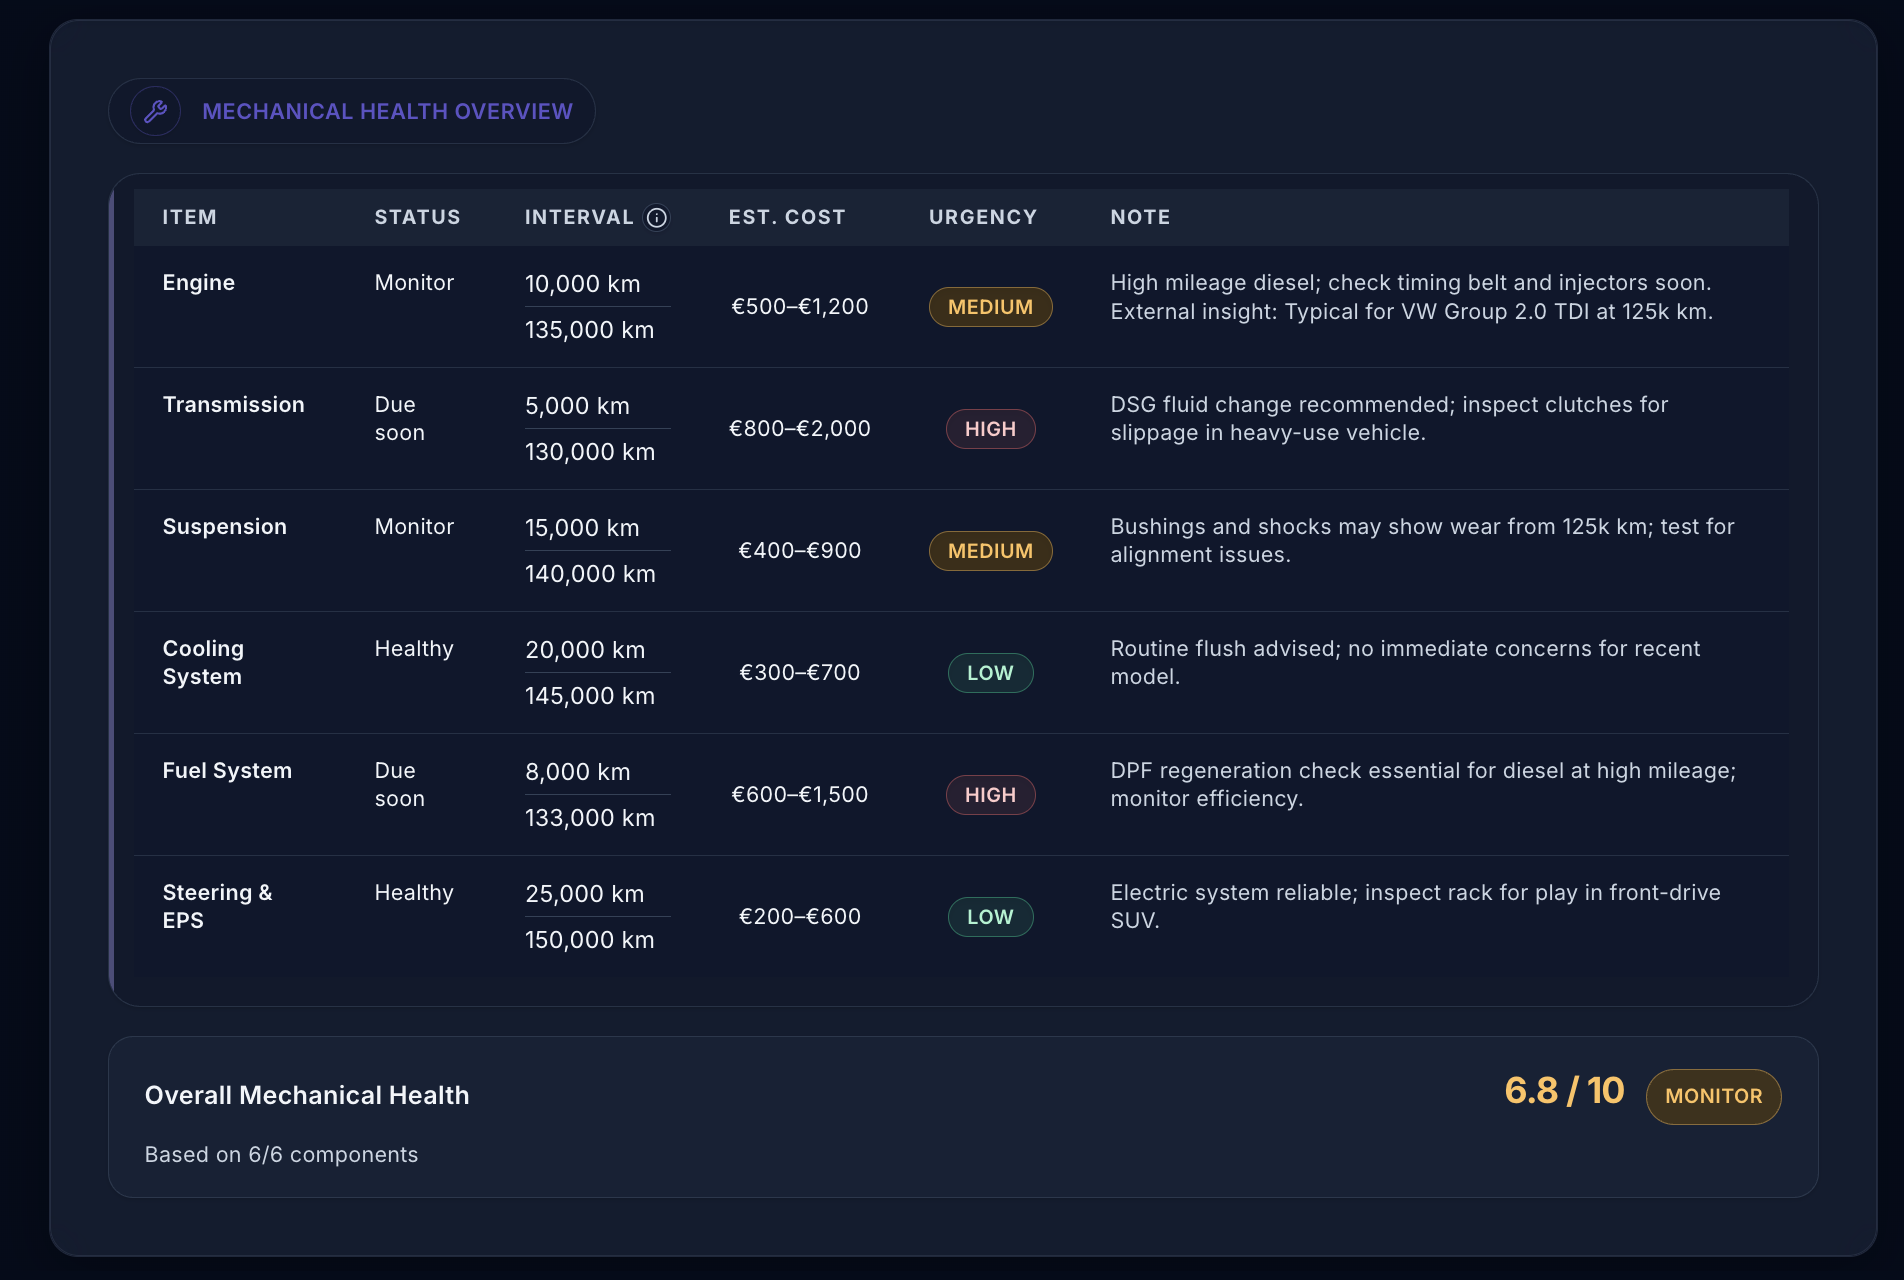
Mechanical health overview
Component-level signals are grouped into due / monitor / healthy slots with cost and urgency context.
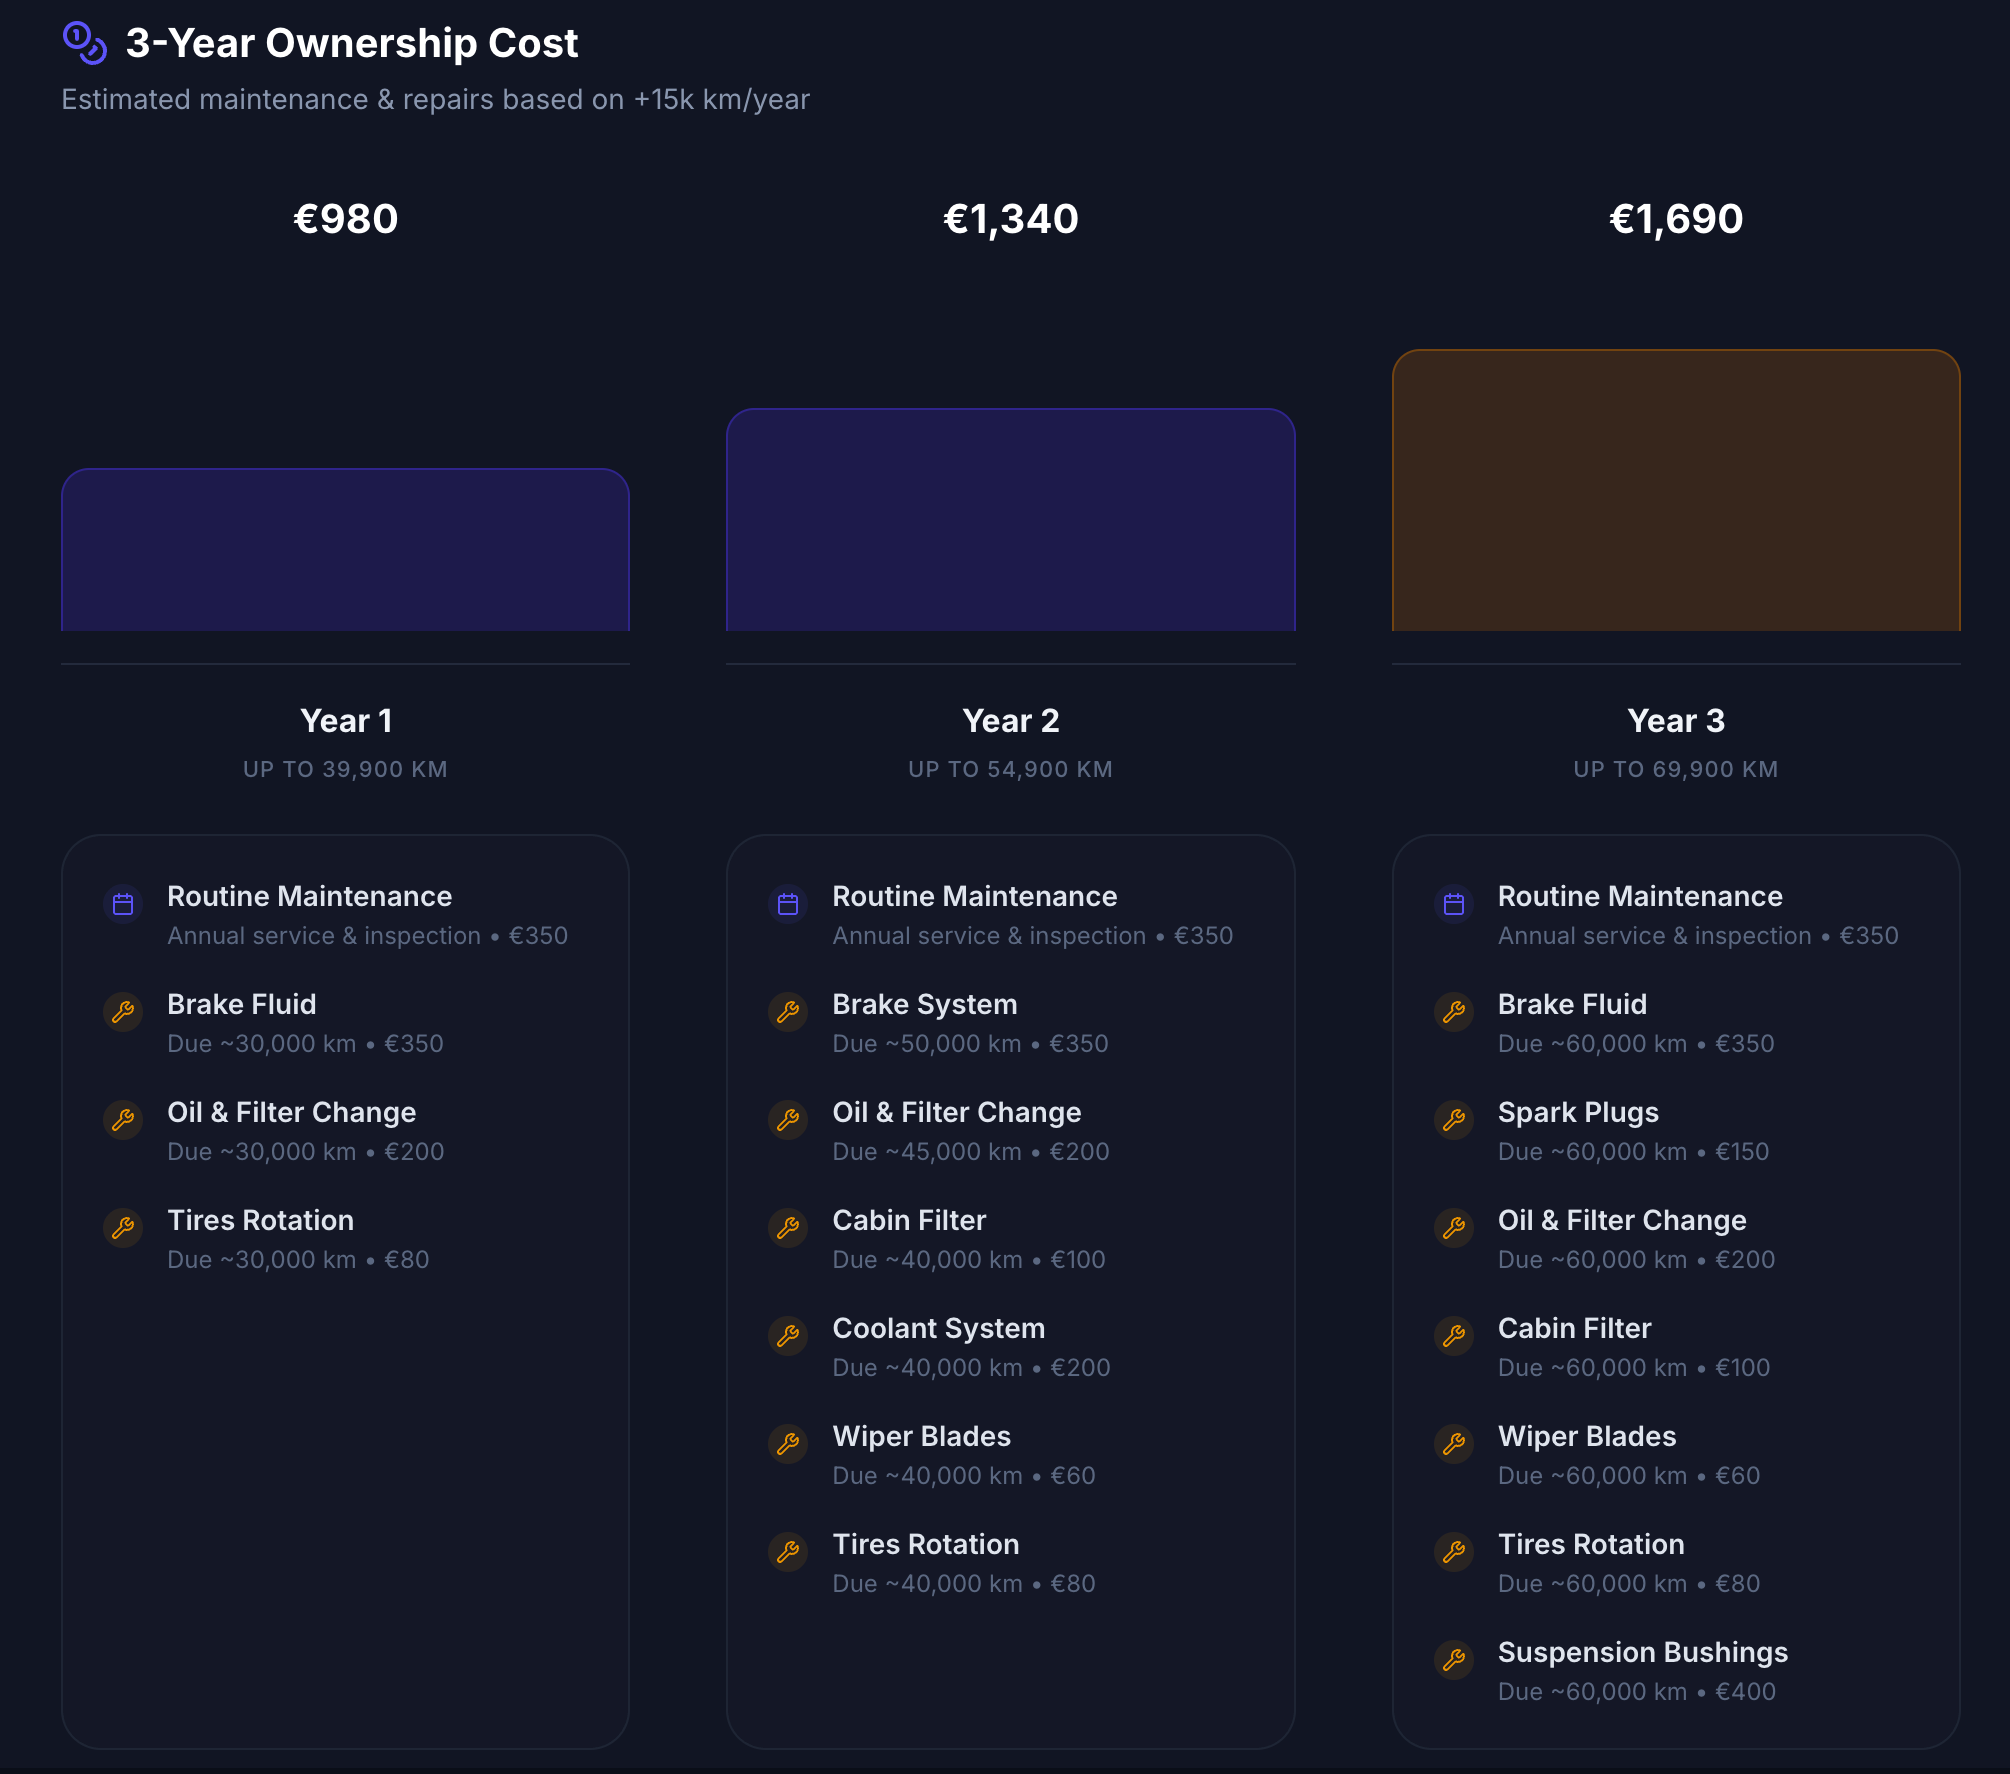
3-year cost estimation
We project upcoming maintenance and potential repairs over the next 36 months based on component wear and model history.
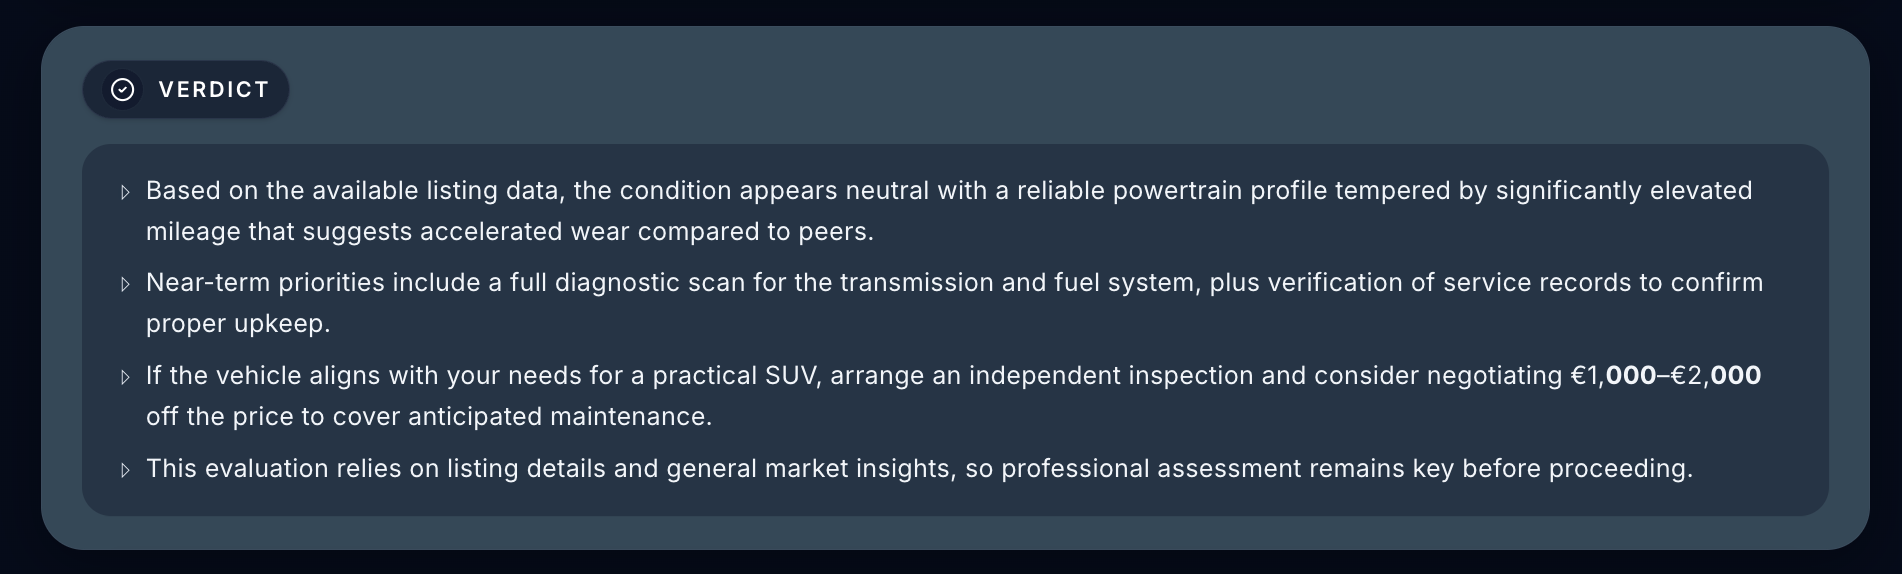
Verdict
Balance, uncertainty, and suggested next steps are presented without persuasion.

See the risks before you see the car.
Anchor your expectations on data, not persuasion, before you commit to a viewing.